|
This
document describes advanced custom reporting subjects and will be updated as
new topics are addressed. If you can’t find what you’re looking for here,
please post a question to the Reports section of the
D-Tools Forum.
ActiveReports User Guide. 2
Subreports. 2
Subreport basics 2
Resorting items in subreports 3
Forcing subreports to filter
differently. 3
Passing values to subreports 3
Modifying the Project Summary. 3
Scripting. 3
Report Utilities 5
Adding Data Fields. 5
Reporting XML structure. 6
Calculated Values. 6
Iterating over data. 7
Grouping and Subtotals. 8
Changing subtotals on proposals 9
Dynamic groupings 9
Custom Sorting. 9
Sorting proposals by price. 9
Page Breaks. 10
Page Size and Margins. 10
Custom Page Size. 10
Changing Margins 10
Gutter Margins 10
Combining Reports. 10
Adding Product Images. 10
Changing List Price to Installed
Price. 11
Separating Accessory Prices from
Parent 11
Insert rtf File and Merge with Data. 11
Client Address Textbox. 11
Show/Hide a Section Based on a
Value. 11
The Report Designer and reporting engine are based on
ActiveReports from DataDynamics. For this reason, it is recommended that you
take a look at the Active
Reports Users Guide to understand the basic concepts behind custom
reports.
Subreports are reports that are called from another report
and can be used to display data differently than on the main report. Two
examples of this are the Miscellaneous Costs and Project Summary subreports,
which are included in Proposals.
 SEE THIS VIDEO
to learn the basics about subreports and see an example of how to modify the
Tax Summary subreport included on Proposals.
SEE THIS VIDEO
to learn the basics about subreports and see an example of how to modify the
Tax Summary subreport included on Proposals.
By default, subreports inherit the sorting and grouping
characteristics of the parent report. Creating a subreport that sorts data
differently requires the use of scripting.
Click
here to read a forum posting that describes how to do this.
By default, subreports will inherit the data filtering
from the parent report. Changing this requires the use of scripting.
Click
here to read a forum posting that describes how to do this.
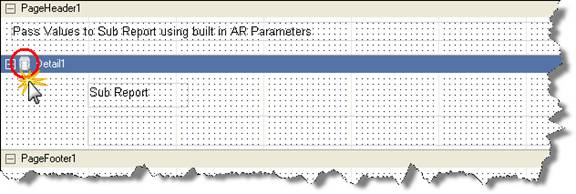
Generally, subreports are not aware of parameter values in
parent reports. To pass a value from the parent report to a subreport
requires the use of scripting.
Click
here to read a forum posting that describes how to do this.
The project summary is a subreport that appears at the end
of proposals, showing the grand totals for the project. While the basic
mechanics for modifying this are the same as any other subreport, we have
created additional documentation to show how to modify this particular report.
Comment: although these examples all use scripting to
accomplish special effects, scripting is not required to modify the project
summary in general.
Click
here to see the basic steps with an example
Click
here to see how to show installation price only and hide labor
Click
here to see how to show only one line item for labor
Scripting is used to take programmatic control of your
reports. Although D-Tools standard reports are written using VB.Net,
it is possible to create reports based on any of these languages:
·
VB.Net
·
C#
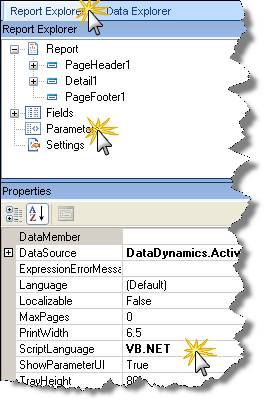
To change the scripting language for a given report, go to
the Report Explorer, select Parameters, and set the ScriptLanguage
accordingly.
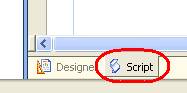
To modify or begin creating script for a given report,
click on the Script tab of the report at the bottom of the Report
Designer window.
Once in the scripting tab, you can take control of the
objects on your report by using the scripting language of your choice. The Active
Reports User Guide and the Report
Utilities API provide additional information about how to do this.
D-Tools has created a variety of helper objects and
functions which make the manipulation of reports easier, and you will see
these used throughout the standard reports. Collectively these are called
Report Utilities.
Please see the Report
Utilities API for more information on these classes and how to use them.
Click
here to see a forum posting about the API document itself and Report
Utilities in general.
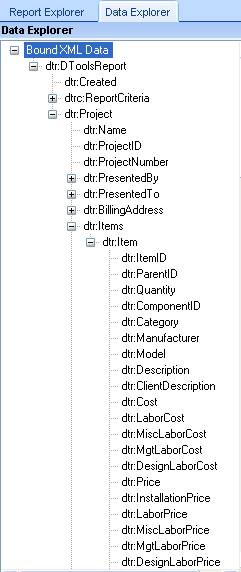
It is possible to add additional data fields to any custom
report. To do this:
1. go to the Data
Explorer tab in the Report Designer
2. expand the Bound
XML Data tab
3. expand the dtr:DToolsReport
node
4. expand the dtr:Project
node
5. drag and drop
the appropriate data field onto the report. This will create a textbox which
is bound to this data field.
Tip: You may need to expand a node further to see all the
data. For example, data fields for individual items in the project (price,
description, etc) can be found in the dtr:Items/dtr:Item node.
The D-Tools SI5 reporting XML structure is defined here:
http://www.d-tools.com/schemas/si5/reports/dtoolsreport.xsd
Using scripting, it is possible to show a calculated value
on a report (for example, show the unit price based on quantity and total
price).
Click
here to download basic instructions with a sample report
Click
here to see how to create a calculated field based on the grand total
of a project
Click
here to see a forum posting including a detailed discussion of
calculated values
Click
here for yet another forum posting discussing calculated values that
other users have found useful
Each report contains a Details section that tells
the report which data field to iterate over, and what to show for each
individual item found therein. For example, proposals iterate over the
dtr:ProposalItems field, which means the detail section will repeat for each
dtr:ProposalItem found.
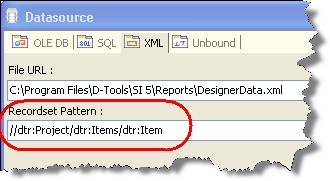
To change the data that the report iterates over,
double-click on the database icon in the Detail1 header.
This opens the Datasource dialog. Change the data
to be iterated over by changing the Recordset Pattern to the XML path
of the data field you wish to use. Do not change the File URL.
Groupings are used to organize and subtotal the items
displayed on a report. You can insert your own groupings by following these
steps:
1. Right-click on
the design pane and select Insert > Group Header/Footer
2. Highlight the GroupHeader
row, go to Properties and set the Data Field property to the
data field you wish to group by. For example, you could group by
dtr:Location, dtr:Zone, or dtr:Phase.
To add a subtotal to a group header or footer, follow
these steps:
1. Drag the data
field you wish to subtotal from the Data Explorer to the header or footer
section (or add a textbox control and set the DataField property to
the desired field).
2. Select the
resulting textbox, go to Properties, and set:
a. SummaryFunc
= Sum
b. SummaryGroup
= name of group header section
c. SummaryRunning
= none
d. SummaryType
= subtotal
Note that these can be changed to achieve different
effects. See the Active
Reports User Guide for more information.
Click
here to learn more about changing the way items aggregate and group.
Click
here to see an example of how to modify the subtotals on proposals to
show both labor and equipment subtotals separately.
In order to make changing groupings possible without
creating a custom report, most standard reports make use of dynamic
groupings. Dynamic groupings determine the field to group by at run time
based on the report definition.
When modifying a standard report, you can identify dynamic
groupings by their names, which must be literal for them to work. These
include: GrpDynamicHeader1, GrpDynamicHeader2, and GrpDynamicHeader3
with associated footers (GrpDynamicFooter1, etc). This is discussed in
more
detail here.
The name of the current header field is stored in a
textbox named txtDynamicHeader1 (2, or 3). So, for example, if the
grouping is location, this textbox will contain the name of the specific
location. You can add a textbox with this name to your report to display the
value of the group.
Not all reports make use of all 3 dynamic headers. To add
one, add a grouping and set the name of this group to one of the names above
(e.g. GrpDynamicHeader3). See this forum posting
for a little more information.
To remove the dynamic functionality of a grouping, the
easiest way is to: 1) rename the grouping header, and 2) set the Data
Field property of the grouping header to the field that you wish to group
by.
Occasionally, the sorting options in the report
definitions do not accomplish the desired results due to the way the report
is grouped.
The best example of this is sorting proposals by price, to
show the most expensive items first within each group.
 SEE THIS VIDEO
to see how to create a custom proposal that sorts items by price, and this forum thread for more
information. SEE THIS VIDEO
to see how to create a custom proposal that sorts items by price, and this forum thread for more
information.
Page breaks are controlled by the GroupKeepTogether,
KeepTogether, and NewPage parameters for individual header rows.
To change these, highlight the header row and modify these in the parameters
window.
It is possible to take programmatic control of your page
size and set it to any value you wish. Click here to see a
forum posting which discusses this.
Note: If you are using a standard page size, you do not
need to do this, but rather would set the page size in the D-Tools Report
Information.
Changing margins or paper sizes requires the user to
create a custom report.
 CLICK HERE
to see a help video showing you how to accomplish this. CLICK HERE
to see a help video showing you how to accomplish this.
Click
here to read a forum posting about gutter margins.
It is possible to combine a number of different reports
into a single report, which maintains page numbers for the whole (as opposed
to Report Groups which number reports individually).
Click
here to see how to do this.
Click
here to see how to add product images to a report that does not have
them, such as the Line Item report.
Click
here to see how to change a list price report to an installed price
report.
On proposals, accessory prices are normally included in
the price of the parent item. Click here to see how
to separate them, or click
here to download a document with sample report.
Through the use of scripting, it is possible to create a
rich text control that includes references to D-Tools data. Click here to learn
more about this.
The client address textbox is different from other textbox
controls, in that the value is set by scripting rather than by binding
directly to data. Click
here to learn more about how to use and modify the client address.
Click
here to see an example of how to show or hide a section based on a value.
|